
Wiley · ENSTK
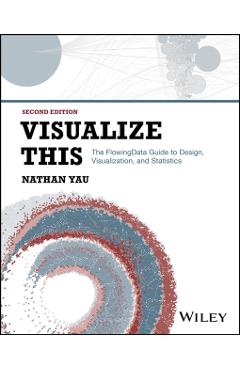
Visualize This: The Flowing Data Guide to Design, Visualization, and Statistics - Nathan Yau
EAN: 9781394214860
Compară ofertele (1)
Prețurile sunt preluate automat din feed-urile magazinelor și pot diferi față de site-ul magazinului. Verifică prețul final la magazin.
Descriere Visualize This: The Flowing Data Guide to Design, Visualization, and Statistics - Nathan Yau
\nOne of the most influential data visualization books--updated with new techniques, technologies, and examples \n \nVisualize This demonstrates how to explain data visually, so that you can present and communicate information in a way that is appealing and easy to understand. Today, there is a continuous flow of data available to answer almost any question. Thoughtful charts, maps, and analysis can help us make sense of this data. But the data does not speak for itself. As leading data expert Nathan Yau explains in this book, graphics provide little value unless they are built upon a firm understanding of the data behind them. Visualize This teaches you a data-first approach from a practical point of view. You'll start by exploring what your data has to say, and then you'll design visualizations that are both remarkable and meaningful. \n \nWith this book, you'll discover what tools are available to you without becoming overwhelmed with options. You'll be exposed to a variety of software and code and jump right into real-world datasets so that you can learn visualization by doing. You'll learn to ask and answer questions with data, so that you can make charts that are both beautiful and useful. Visualize This also provides you with opportunities to apply what you learn to your own data. This completely updated, full-color second edition: \n \n- Presents a unique approach to visualizing and telling stories with data, from data visualization expert Nathan Yau \n- Offers step-by-step tutorials and practical design tips for creating statistical graphics, geographical maps, and information design \n- Details tools that can be used to visualize data graphics for reports, presentations, and stories, for the web or for print, with major updates for the latest R packages, Python libraries, JavaScript libraries, illustration software, and point-and-click applications \n- Contains numerous examples and descriptions of patterns and outliers and explains how to show them \nInformation designers, analysts, journalists, statisticians, data scientists--as well as anyone studying for careers in these fields--will gain a valuable background in the concepts and techniques of data visualization, thanks to this legendary book.\n
Detalii
- Brand
- Wiley
- Categorie
- ENSTK
- EAN / GTIN
- 9781394214860
- Magazine
- 1
- Disponibilitate
- in stock
Produse similare

Wiley
The Pirate Inside: Building a Challenger Brand Culture Within Yourself and Your Organization - Adam Morgan
251,10 RON
libris.ro

Wiley
PHP & MySQL: Server-Side Web Development - Jon Duckett
251,10 RON
libris.ro

Wiley
Hands on Hacking: Become an Expert at Next Gen Penetration Testing and Purple Teaming - Matthew Hickey
251,10 RON
libris.ro

Wiley
The Portable MBA in Entrepreneurship - William D. Bygrave
251,10 RON
libris.ro

Wiley
Championship Selling: A Blueprint for Winning with Today's Customer - Tom Blake
251,10 RON
libris.ro

Wiley
The Borderless Healthcare Revolution: The Definitive Guide to Breaking Geographic Barriers Through Technology - Sarah Matt
251,02 RON
libris.ro

Wiley
Cohousing Communities: Designing for High-Functioning Neighborhoods - Jingling Yang
251,02 RON
libris.ro

Wiley
Securing What Feeds Us: Cybersecurity in Food and Agriculture - Kristin King
251,02 RON
libris.ro